liquidmap guides
Crypto order flow: what it is and how to read it.
Price moves because of orders. Some sit still in the order book; others hit the market and push it. Order flow is reading those orders instead of looking only at the candle. This guide explains the five basic pieces, with real screenshots of the liquidmap terminal.
Updated
What order flow is
A candlestick chart summarizes what the price did: it opened, rose, fell, closed. Order flow looks at what is behind it: who bought and sold, how much, at what price, and which orders are still waiting.
There are two kinds of orders. Limit orders wait in the book for the price to reach them. Market orders execute immediately against the ones that are waiting, and they are what moves the price. Everything in this guide comes from reading how they interact.
1. The order book and its heatmap
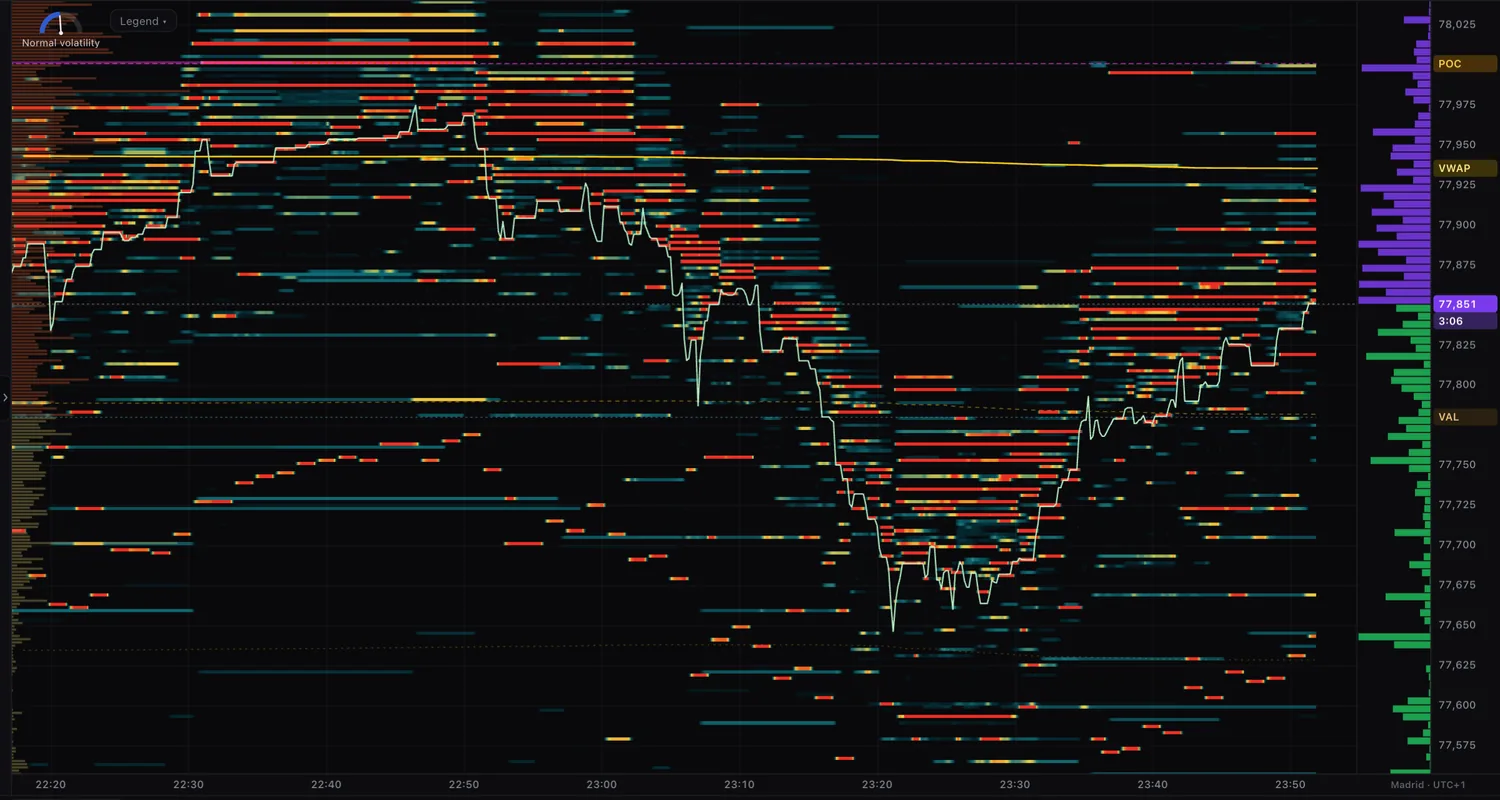
The order book lists the limit orders to buy (below the price) and to sell (above it), with their size. A heatmap draws it over time: the brighter a band, the more orders are waiting at that price. Those levels are called walls, and they are places where the price may stall or bounce.
Two warnings to read it well: an order in the book is not an executed order, and it can be pulled before the price gets there. What matters is watching it hold, or vanish as the price approaches. And a single exchange is not the whole market: that is why liquidmap can combine up to 15 order books from 10 exchanges.
2. Large market orders
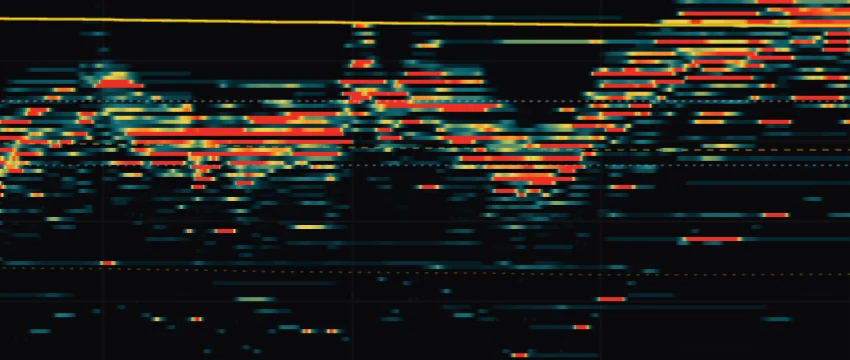
A large market order eats through the book as it goes. In liquidmap each one is a bubble with its size: its position tells you whether it was a buy or a sell, and its size how much money came in at once. What matters is what happens next: whether the price keeps going and breaks through, or stays where it was and the burst is absorbed.
3. The footprint
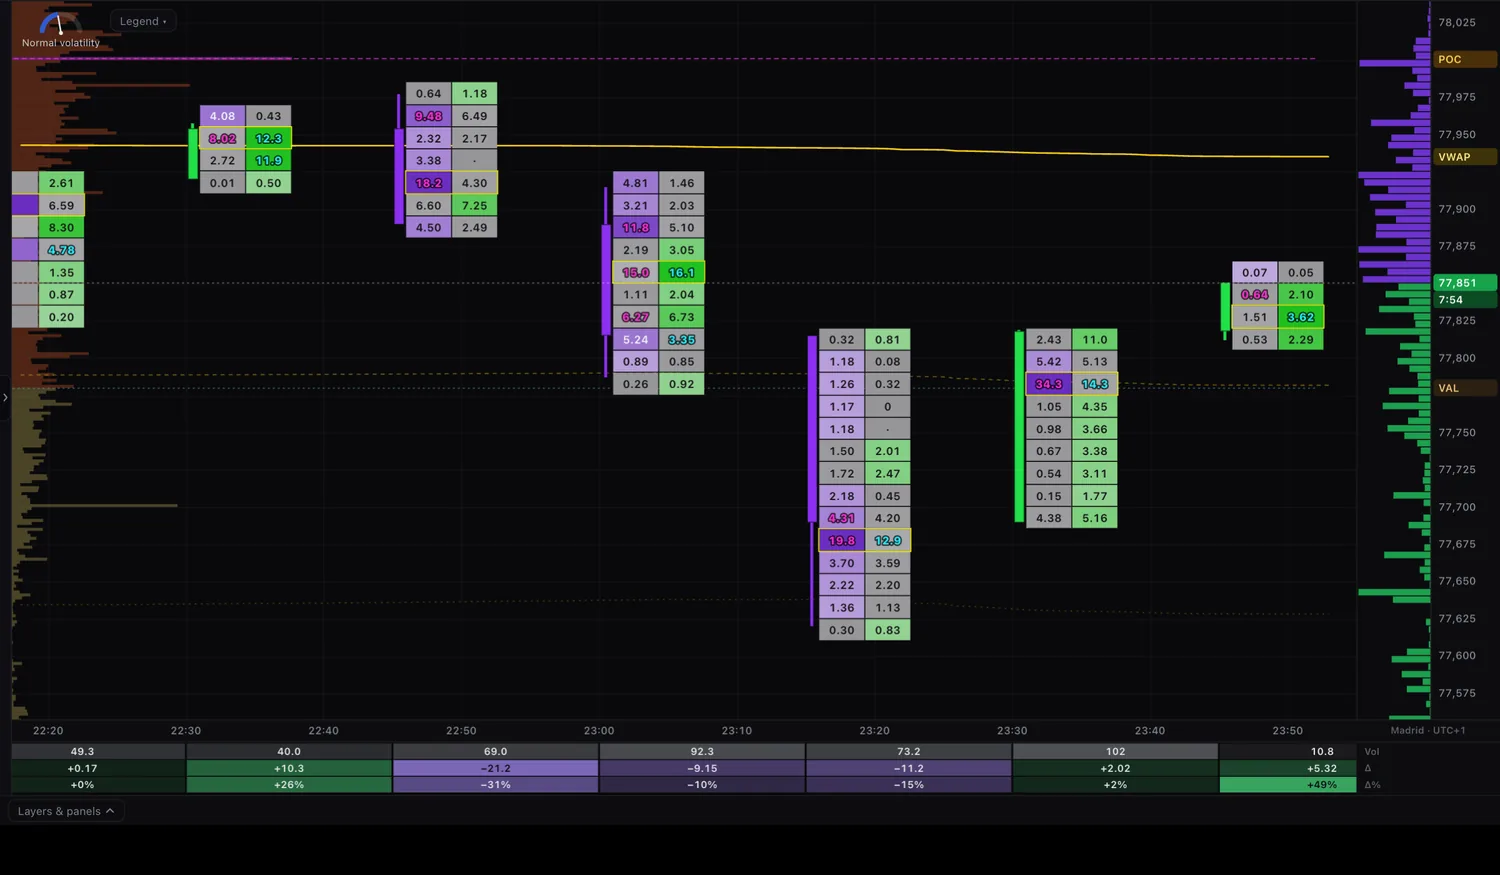
A candle only keeps four prices: open, high, low and close. The footprint opens the candle and writes, at each price, how much was sold at market (on the left) and how much was bought (on the right). Two candles that look the same can tell opposite stories.
On top of the footprint you read imbalances (much more bought than sold at a price, or the reverse), the POC (the price with the most volume) and volume profiles.
4. Delta and CVD
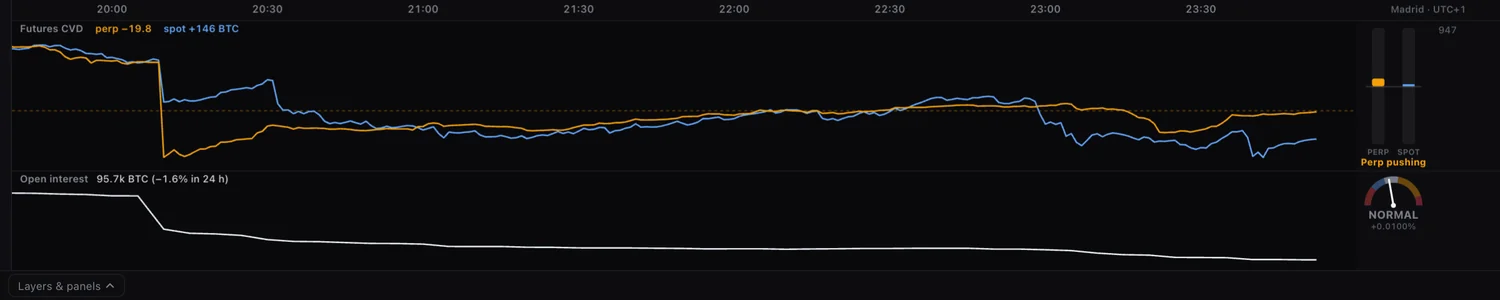
A candle’s delta is what was bought at market minus what was sold at market. If it is positive, aggressive buyers won that candle; if it is negative, sellers did. CVD (cumulative volume delta) adds the delta up candle by candle, and shows whether buying or selling pressure holds or fades.
In crypto there is an extra reading: comparing spot CVD with perpetual CVD. A common reading is that if the price rises pushed by the perpetual and spot does not follow, the move has more leverage behind it. It is a hint, not a rule: it is read together with open interest, funding and liquidations.
5. Absorption
There is absorption when a lot of aggressive volume comes in and the price barely moves: on the other side, large limit orders are taking everything. In the terminal you spot it by putting several pieces together: a big burst, a lot of volume on the footprint at one price and a wall on the heatmap that does not give way.
Absorption is not a buy or sell signal. It is information about who is taking the other side of everyone else’s orders, and it is read in context: where it happens, in what trend, and what the price does next.
How the five pieces fit together
A simple way to organize it is four questions:
- Where is the money waiting? The order book heatmap.
- Who is entering hard? Bursts (large market orders).
- What happened inside the candle? The footprint.
- Who is really pushing? Delta and CVD, spot and perpetual.
Order flow helps you understand what is happening in the market now; it does not predict what will happen. It is not investment advice and it does not guarantee results: the decision is always yours.
Frequently asked questions
What is order flow?
It is reading the orders that move the market (which ones wait in the book and which execute at market, at what price and what size) instead of looking only at the candle price.
What is the difference between delta and CVD?
Delta is what was bought at market minus what was sold at market over a period, for example one candle. CVD is the running total of those deltas: it shows the direction of the pressure over time.
What is absorption in order flow?
It is when a lot of market volume comes in and the price barely moves, because large limit orders on the other side are absorbing it. It is read in context; it is not a signal by itself.
Can I see all this on my phone?
Yes. liquidmap opens in the browser, on desktop and on mobile, with the same order book, footprint and bursts. You do not need to connect your exchange account.
Sources and date
Real screenshots of the liquidmap terminal (BTC/USDT, November 1, 2026). Educational guide: nothing on this page is investment advice or a promise of results.